Latest Advances from IAHR's Flood Risk Management Technical Committee

IAHR Technical Committee on Flood Risk Management
Newsletter 1-2026: Advances in Flood Risk Management
Technical Committee on Flood Risk Management Activities
The 9th IAHR Europe Congress in Luleå brought together researchers, engineers, practitioners, and decision-makers to discuss innovative approaches for sustainable hydro-environment engineering under the theme "Innovating Hydro-Environment Engineering for a Sustainable Future: Arctic Waters and Beyond." Across more than 270 presentations, the congress addressed topics including climate adaptation, digital water management, resilient infrastructure, and sustainable management of rivers, lakes, and coastal environments.
The special session "Integrated Flood Risk Management – From Science to Practice" highlighted how scientific research can be translated into practical solutions for improving flood resilience. Several contributions focused on improving the understanding of flood-generating processes to support better decision-making. Studies on compound coastal and river flooding demonstrated how interactions between sea level and river discharge can be quantified to improve flood hazard assessment, while research on historical flood reconstruction illustrated how combining hydrological observations with snowpack characteristics can strengthen early warning systems and real-time flood preparedness. Innovative engineering solutions were also presented, including the evaluation of biopolymer foams for sustainable stormwater storage applications.
The session concluded with a broader perspective on flood-resilient urban rivers, emphasizing that
effective flood risk management requires interdisciplinary collaboration and the integration of
hydraulic engineering, river restoration, ecology, and urban planning. Overall, the session illustrated
that bridging the gap between science and practice relies not only on advances in modelling and
monitoring, but also on developing transferable methodologies, sustainable engineering solutions,
and collaborative frameworks that support evidence-based decision-making and climate-resilient
water management.
Recent Flood Events Around the World
In the second half of previous and in the beginning of this year several places in the World were hit by severe floods. The portal Sustainability Global briefly summarizes the situation in 2025. Between the 10 greatest flood events of this period, we may find countries located in Asia (Afghanistan, Nepal, Pakistan, India), Africa (Nigeria, Kenya, Tanzania, Burundi), Australia, and USA. The greatest of the second half of 2025 happened in Texas, USA between July 4-5th. The Texas Hill Country was hit by about 250 mm rain in just hours (Fig. Z1a). There were 131 fatalities and the estimated loses are about $20 billon.
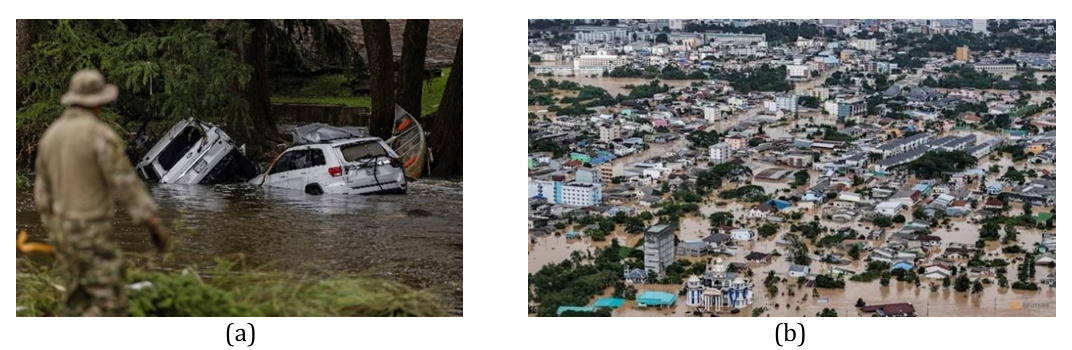
Figure Z1. Scenes from the floods in 2025: (a) Texas Hill Country, July 4-5, 2025 [source], (b) Hat Yai, November 2025 [source]
From the other side, the Center for Disaster Philanthropy describes horrible situation in Southeast Asia in November 2025. Severa countries in the region (Vietnam, Thailand, Malaysia, Indonesia, the Philippines) were hit by disastrous monsoons and multiple typhons. It cased inundations, landslides and storm surges. The estimated number of fatalities is greater than 1100. Millions of people were evacuated. E.g. in Thailand the rainfall reached almost 600 mm in the days between November 19 and 22. The most experienced was the city of Hat Yai (Fig. Z1b) located in the southern part of the country. According to Nestopa portal, “The flooding affected over 1.9 million people […]. More than 150,000 residents in the city were directly impacted, and at least 25,102 homes suffered significant damage. […] officials reported 85 fatalities”.
The first half of 2026 was not better. In the South Africa flooding which started in December 2025 was elongated next months. According to the portal AdademicJobs reporting on this event, the main cause was torrential rain intensified by combination of La Nin a and climate change. Almost 4 thousand of households were affected, at least 57 fatalities were reported, dozens of people were injured (ReliefWeb). The estimated losses are about 4 billion ZAR (South African Rand) what is almost $250M. On January 17th the national state of disaster was declared. Many vulnerabilities were exposed by this event. More information about the event may be found in paper published by AcademicJobs or news presented by ReliefWeb.
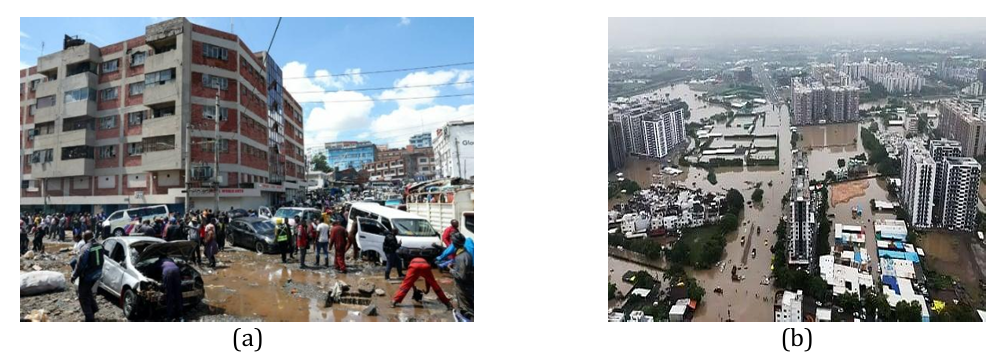
Figure Z2. Scenes from the floods in 2026: (a) Flood in Nairobi, Kenya [source], (b) Flood in Surat, Gujarat, India [source]
A short time later, in March, the floods hit another place in Africa. The capital of Kenya, Nairobi, was affected heavy flash flooding due to intense rainfall (more info). The situation was very similar to that observed in Valencia in 2024 (described in one of the previous newsletters). The cars were swept by water flowing rapidly over streets (more info) (Fig. Z2a). In the same time, flooding was reported in 30 other counties. Over 100 fatalities were reported and almost 7000 households were damaged.
Almost simultaneously, the two storms affected the Hawaiian Islands. The maximum rainfall was over 1390 mm. Fortunately, there were no fatalities, but the estimated damages are about $1 billion (more info). Due to this, the Governor of Hawaii requested a federal disaster declaration on March 24th. The declaration was approved on April 7th. About two months later, in May, the floods hit Syria in the Middle East. The inundation of the fluvial type was caused by the Euphrates River. Affected areas include Deir ez-Zor and Ar-Raqqa governorates in addition to Jarabulus from Aleppo governorate. The increased inflow, reportedly reaching approximately 2200 m³/s, is mainly attributed to seasonal snowmelt and the opening of spillways at upstream dams. 7,210 hectares of agricultural land where under water, what is equivalent to 8.2% of all cultivated land in Deir-ez-Zor Governorate, at a critical time during the wheat harvest period. The result was the displacement of at least 1,626 families (approx. 8,280 people) in Deir-ez-Zor Governorate, partial flooding of displacement sites in Ar-Raqqa, around 30 families, damage to agricultural land and disruption to critical infrastructure, including water stations and local access routes (more info)
A few days ago, on 8 July 2026, Surat (Gujarat, India) experienced one of its most severe urban flood events in recent years after receiving approximately 358 mm of rainfall within 24 hours, overwhelming the city's stormwater drainage system and inundating large parts of the urban area (Fig. Z2b). Low-lying localities, including Varachha, Katargam, Dabholi, Udhna, Adajan, Limbayat, and several creek-side neighborhoods, were severely affected, resulting in widespread waterlogging, disruption of road and rail transport, closure of educational institutions, and suspension of commercial activities. More than 3,800 residents were shifted to safer locations, while over 3,400 people were rescued by the NDRF, SDRF, Fire Brigade, and local authorities. The flooding caused extensive damage to residential properties, commercial establishments, vehicles, public infrastructure, and industrial units, leading to economic losses estimated to be in the hundreds of crores of rupees, although a final official assessment is still underway. The disaster also resulted in multiple rain-related fatalities across Surat district, highlighting the increasing vulnerability of rapidly urbanizing cities to extreme monsoon events and emphasizing the urgent need for resilient urban drainage systems, flood forecasting, and integrated flood risk management. More information may be found in articles by Times of India, and New Indian Express.
What to Expect Next: El Niño in Pacific South America
The arrival of a new El Niño episode poses major hydrometeorological risks for the Pacific coast of South America, particularly for Ecuador, Peru, and Chile. Historically, Peru and Ecuador have suffered the most severe flood damages due to intense rainfall anomalies associated with El Niño, while Chile experiences more localized but still significant impacts, especially in northern desert basins and central valleys. It is suggested that Peru has not achieved meaningful flood vulnerability reduction despite repeated catastrophic events, unlike Chile and, to a lesser degree, Ecuador. Structural weaknesses in engineering planning, institutional coordination, and project delivery remain major barriers. El Niño–Southern Oscillation (ENSO) is the most influential climatic driver affecting western South America. During El Niño, anomalous warming of equatorial Pacific waters modifies atmospheric circulation and shifts rainfall patterns. For Pacific South America, the consequences are highly uneven. In Ecuador the heavy coastal rainfall, river flooding, and landslides are expected. Peru may experience catastrophic flash floods, debris flows (huaicos), and urban inundation. Chile is prone to altered precipitation patterns, river flooding, debris flows, and infrastructure stress. It is known that the strongest historical El Niño events (1982–83, 1997–98, and Coastal El Niño 2017 and 2023) caused billions of dollars in damages. The future losses may be in the same level.
Found in the Net
An interesting global geospatial dataset is available through the Google Research Open Buildings project (Fig. X1a), which can be accessed at Google Research Open Buildings. The dataset was created using advanced deep learning techniques to detect building footprints from high-resolution satellite imagery. The current release is Version 3, which contains approximately 1.8 billion building detections across an inference area of 58 million km², covering Africa, South Asia, Southeast Asia, Latin America, and the Caribbean.
The data are freely available for download in CSV format for the regions shown in Fig. X1b. For each detected building, the dataset provides its footprint geometry together with a confidence score indicating the likelihood that the detected object is a building. To facilitate quality assessment, the authors recommend confidence thresholds of 0.65–0.70, 0.70–0.75, and greater than 0.75, allowing users to select an appropriate balance between completeness and reliability.
Although the dataset is not free from errors and uncertainties, it represents a valuable source of information for a wide range of applications, including flood risk assessment, hydrological modelling, exposure analysis, and other water management projects. In particular, it can provide a practical alternative in regions where detailed building or land-use inventories are unavailable or incomplete, thereby supporting more informed planning and decision-making.
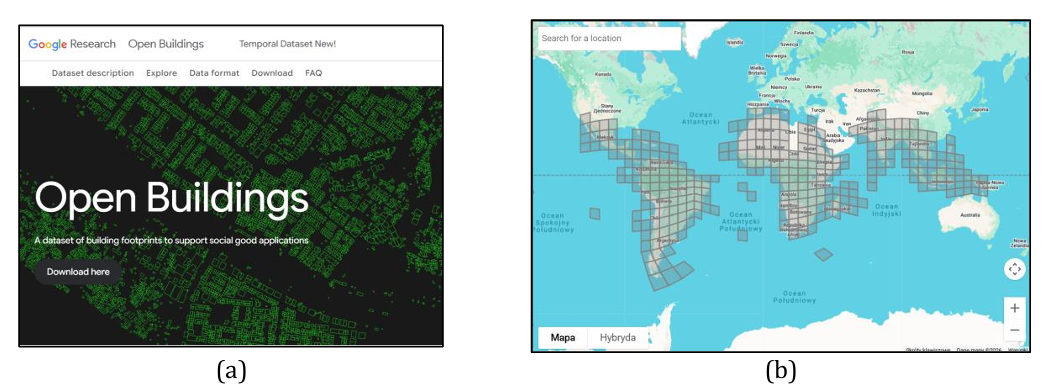
Figure X1. The Google Research Open Buildings project: (a) The project's main webpage, (b) The map showing the regions currently covered by the Open Building dataset
Another valuable source of geospatial data is available through the Copernicus Data Space Ecosystem (CDSE). One of its key products is the Copernicus Digital Elevation Model (Copernicus DEM) (Fig. X2a). This open-access digital elevation model is based on data acquired during the TanDEM-X mission, which was conducted between 2011 and 2015. The first public release of the dataset was made available in 2019, and it continues to be maintained and updated.
The Copernicus DEM is provided at three spatial resolutions: 10 m, 30 m, and 90 m. The 30 m and 90 m products provide near-global coverage and represent a high-quality alternative to other widely used global DEMs, such as SRTM and AW3D. The highest-resolution 10 m product is currently available primarily for Europe (Fig. X2b), but it also covers several European overseas territories, including French Guiana in South America and islands in the Atlantic and Indian Oceans.
The availability of the 10 m product beyond continental Europe demonstrates that there are no inherent technical limitations preventing its wider distribution. It is therefore reasonable to expect that high resolution global coverage may become available in the future, further enhancing the value of the Copernicus DEM for hydrological modelling, flood risk assessment, and other water management applications.
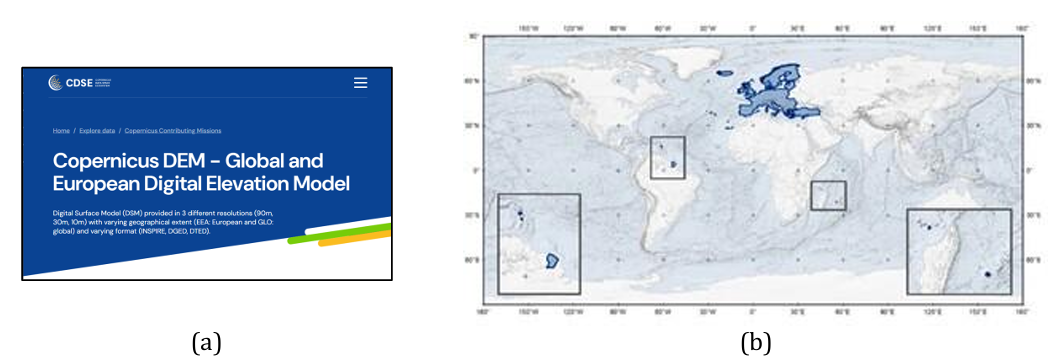
Figure X2. The Copernicus DEM dataset: (a) The main webpage of the Copernicus Digital Elevation Model, (b) The geographical coverage of the highest-resolution (10m) dataset
Software Advancements
Recent developments in hydraulic modelling software have introduced several innovative concepts that are likely to influence future modelling workflows. One of the most notable examples is the new HEC-RAS 2025 development branch (more info). The project introduces a completely redesigned, GIS-oriented interface together with a new approach to computational mesh generation. Following the initial Alpha release, the software has now reached the Beta 2 stage (Fig. X3a). The key innovation is the introduction of the conceptual mesh, a new paradigm that significantly simplifies the creation and management of computational meshes. Unlike previous workflows, the conceptual mesh separates model design from the numerical mesh itself, making model preparation more intuitive and allowing modifications to be implemented more efficiently. Combined with the previously introduced subgrid technology, this approach further strengthens HEC-RAS as one of the leading tools for two-dimensional hydraulic modelling by improving both modelling flexibility and computational efficiency. To support users in adopting these new features, the development team maintains the HEC-RAS 2025 YouTube channel, which provides a growing collection of tutorials, demonstrations, and technical presentations ranging from introductory topics to advanced modelling techniques (Fig. X3b).
Figure X3. The HEC-RAS: (a) The official logo of the new software branch, (b) Screenshots from tutorials available on the HEC-RAS 2025 YouTube channel
Another important trend in hydraulic modelling is the integration of Geographic Information Systems (GIS) with flood simulation engines. This functionality is now available in recent versions of ArcGIS Pro developed by Esri. After converting a standard map into a three-dimensional scene, users can configure and run flood simulations directly within the GIS environment (Fig. X4a). Model setup, including rainfall input and additional water sources, is relatively straightforward, making the tool accessible to users with limited hydraulic modelling experience. The simulation engine is based on a simplified formulation of the two-dimensional shallow water equations, with further technical details provided in the Esri Technical Paper.
A similar approach is offered by the web-based GIS platform SCALGO, where flood analysis tools are integrated with the TUFLOW hydraulic modelling engine. In this case, simulations are performed in the cloud, eliminating the need for local high-performance computing resources and enabling rapid assessment of flood scenarios (Fig. X4b). Cloud-based computation also facilitates collaborative workflows and improves accessibility for users.
Although both solutions are commercial and require software licenses, they illustrate the growing convergence of GIS and hydraulic modelling technologies. This integration has the potential to make flood analysis more efficient and accessible to a broader community of practitioners. It is reasonable to expect that similar capabilities will increasingly become available in open-source and lower-cost software solutions in the coming years.
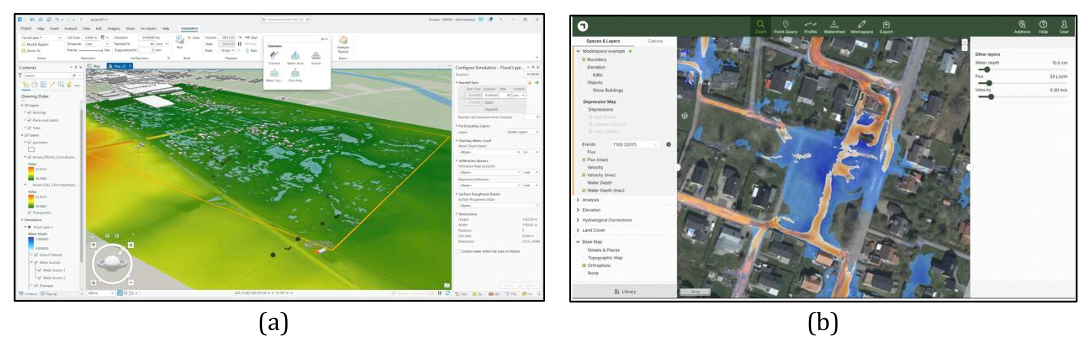
Figure X4. Hydrodynamic simulations integrated with GIS software: (a) Pluvial flood modelling in ArcGIS Pro for the municipality of Strózki, Poland; (b) Hydrodynamic simulation in SCALGO, shown in a tutorial available here
Another noteworthy trend is the continued development of tools for integrated urban flood modelling. Recent software developments increasingly combine surface runoff simulation with underground stormwater drainage networks, enabling more realistic representation of urban flooding processes.
In HEC-RAS, pipe network simulation has been available for several years, although the initial implementation was primarily intended for testing and early-stage development. In the latest versions, however, pipe networks have been fully integrated into RAS Mapper and the hydraulic simulation framework (Fig. X5a), providing a much more streamlined workflow for model creation, visualization, and analysis. Comprehensive documentation and dedicated tutorials are available to support users in building and simulating urban drainage systems.
Similar developments are taking place in the Iber hydraulic modelling package. In addition to ongoing improvements to its urban flood modelling capabilities, the Iber development team has released IberGIS, a plugin for QGIS that facilitates the integration of Iber with the Storm Water Management Model (SWMM) (Fig. X5b). While Iber is primarily used for two-dimensional surface flow simulations, SWMM is a well-established model for the design and analysis of urban stormwater and sewer pipe networks. Their integration enables coupled surface–subsurface simulations, providing a comprehensive framework for analysing urban flooding and evaluating drainage infrastructure under extreme rainfall conditions.
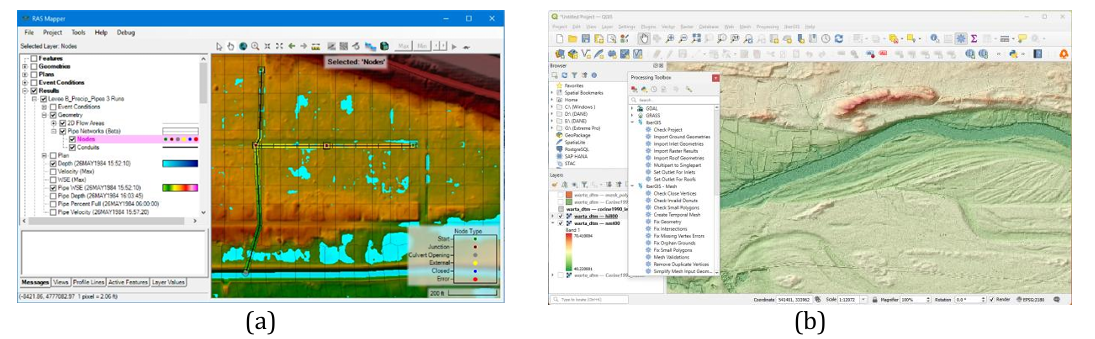
Figure X5. Recent Developments in flood simulation software: (a) Pipe network modelling in HEC-RAS [source: HEC-RAS documentation], (b) Integration of Iber and SWMM withi the QGIS environment, showing the IberGis toolbox
This newsletter is edited by Tomasz Dysarz. If you are interested in presenting actual developments within our newsletter, please send your contributions to Dr. Tomasz Dysarz (tomasz.dysarz@up.poznan.pl).
Related
IAHR Technical Committee on Flood Risk Management
Register for the 3rd Flood Risk Management Webinar